There's A Lot At Stake In The Weekly U.S. Drought Map
"Crippling drought this year has caused more than $1 billion in damage. As it's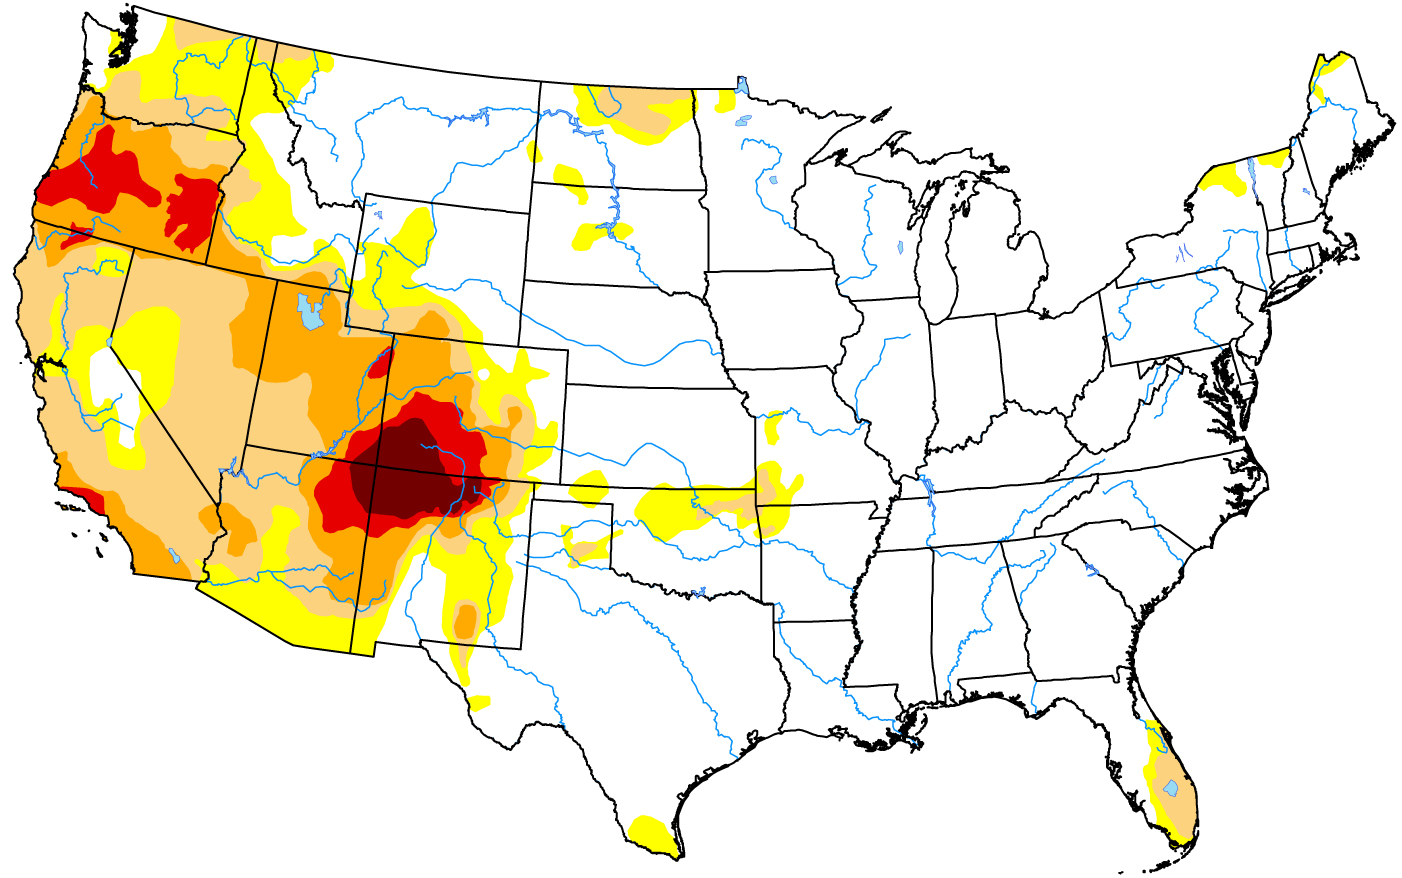 played out, anyone affected by the drought or trying to manage it has turned to a once obscure map that's become key to understanding what's happening: the U.S. Drought Monitor."
"That includes water planners who decide resource allotments. Farmers who need water for their livelihood. Federal bureaucrats who use the map to calculate aid for the Livestock Forage Disaster Program."
"And then there are citizen scientists like Dave Kitts outside of Sante Fe, N.M."
'I think it's a little obsessive, but I check it every Thursday,' says Kitts, who's lived on the same 2-acre spread in New Mexico for decades. Dry years like this past one can crust the soil and kill his pinyon trees."
"'It's just upsetting and depressing to me,' he says. 'And when it moves the other direction it definitely lifts my spirits.'"
Scientist Mark Svoboda started the drought map 20 years ago, when Congress took an interest after drought struck Washington, D.C. He directs the National Drought Mitigation Center at The University of Nebraska-Lincoln.